Upwelling Detection Tool
The automatic Upwelling Detection Tool is a new functionality built on top of an existing 3D CEMBS system.
It was developed in 2017 and introduced in an operational mode in early 2018. It is based on a method
presented in a study by Andreas Lehman [1]. The method was modified and adapted in order to
function correctly with the 3D CEMBS model [2-3]. It was described and evaluated based on a data collected between 2010 and 2016 [4].
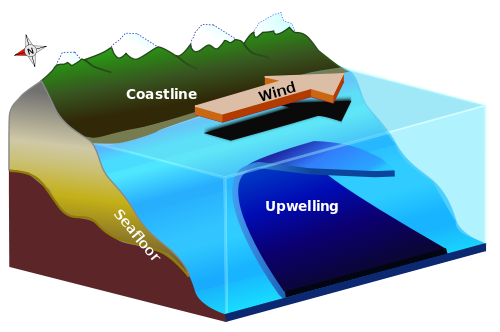
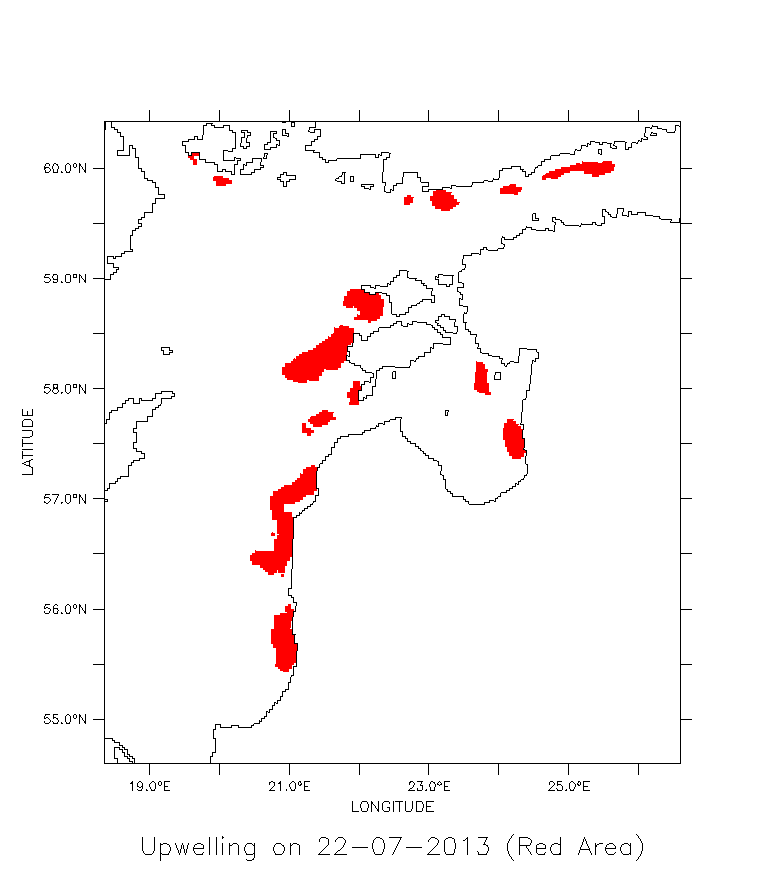
The method assumes that during the upwelling, water from below thermocline reaches the surface, causing significant drop in temperature.
Therefore, this method is only able to detect strong coastal upwelling events during stratified period of the year.
As a result of this limitation, the tool is used only for data between May and September.
The tool is based on the assumption, that there is a latitudinal SST gradient from south to north, following previous studies [1, 5].
Thus, the entire area of the Baltic Sea was divided into latitudinal zones. Mean temperature was calculated for each zone.
Upwelling was detected, if temperature at a specific pixel differed from corresponding mean value by more than a threshold of 2°C.
In addition to achieve more accurate results, mean temperatures were calculated independently for the entire areas of Gulf of Finland, Gulf of Riga and part of Bay of Bothnia.
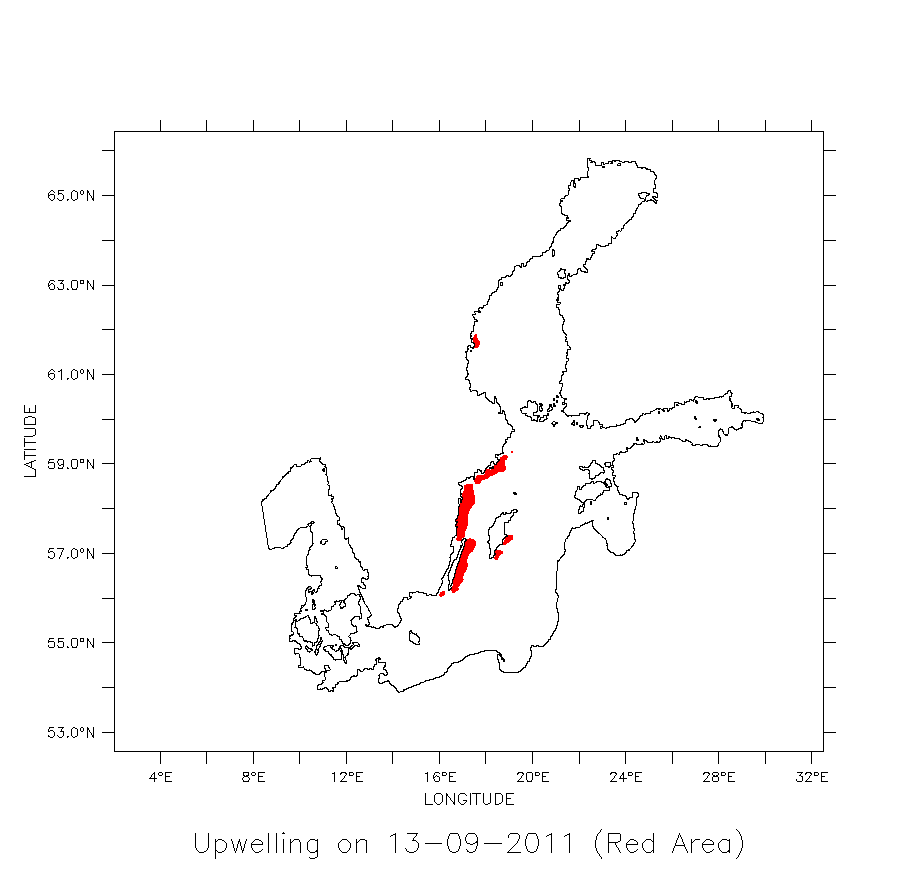
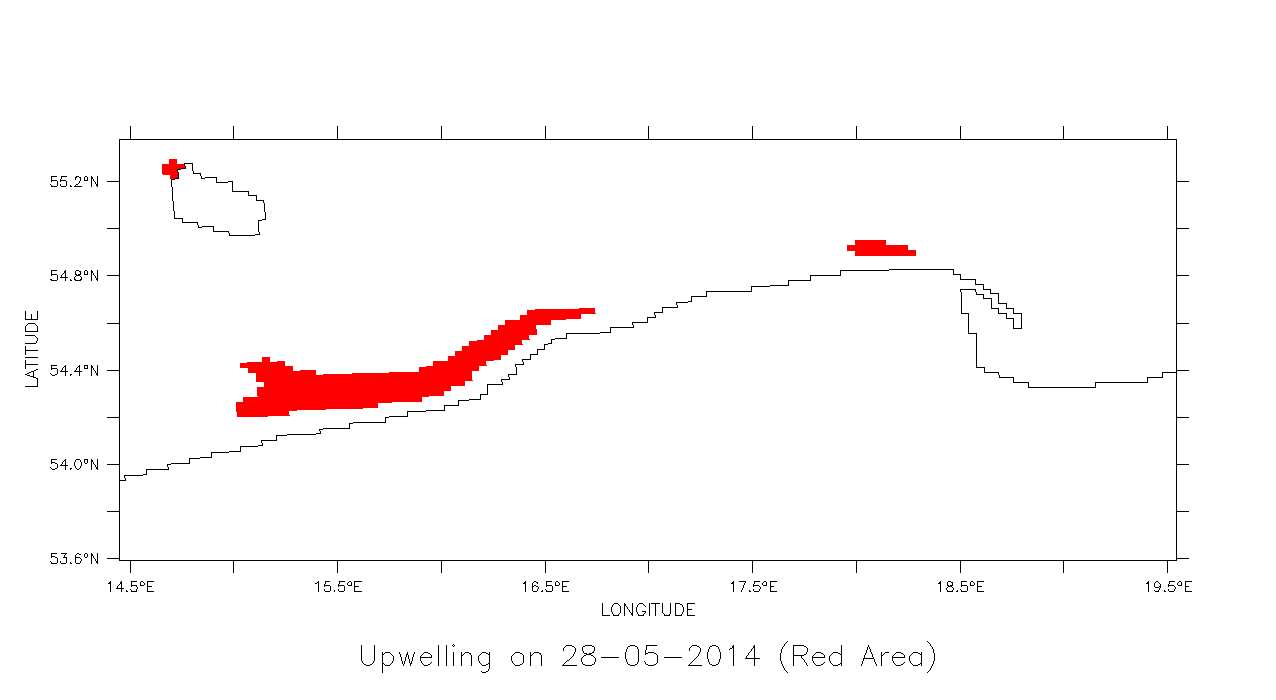
Results are presented in horizontal resolution of ~2.3 km, which derives directly from 3D CEMBS properties.
Open sea data are masked since the tool focuses on coastal upwellings only.
Data access and sample maps
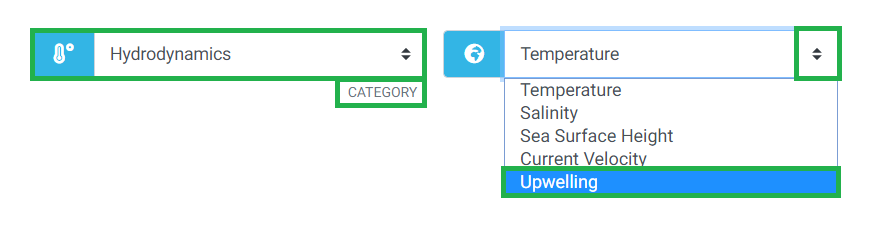
Results can be accessed via FORECAST and ARCHIVE tabs.
Make sure CATEGORY is set to Hydrodynamics.
Then select Upwelling from the PARAMETER list.
References
- [1] Lehmann A., Myrberg K., Höflich K. (2012). A statistical approach to coastal upwelling in the Baltic Sea based on the analysis of satellite data for 1990–2009. Oceanologia, 54(3), pp. 369-393, http://dx.doi.org/10.5697/oc.54-3.369
- [2] Dzierzbicka-Glowacka L., Jakacki J., Janecki M., Nowicki A. (2013). Activation of the operational ecohydrodynamic model (3D CEMBS) – the hydrodynamic part. Oceanologia, 55(3), pp. 519-541, https://doi.org/10.5697/oc.55-3.519
- [3] Nowicki A., Dzierzbicka-Glowacka L., Janecki M., Kalas M. (2014). Assimilation of the satellite SST data in the 3D CEMBS model. Oceanologia, 57(1), https//dx.doi.org/10.1016/j.oceano.2014.07.001
- [4] Nowicki A., Janecki M., Dzierzbicka-Głowacka L. (2019). Operational system for automatic coastal upwelling detection in the Baltic Sea based on the 3D CEMBS model. Journal of Operational Oceanography, https://doi.org/10.1080/1755876X.2019.1569748
- [5] Bychkova I., Viktorov S., Shumakher D. (1988). A relationship between the large scale atmospheric circulation and the origin of coastal upwelling in the Baltic. Meteorol. Gidrol., 10, pp. 9-98, (in Russian).